
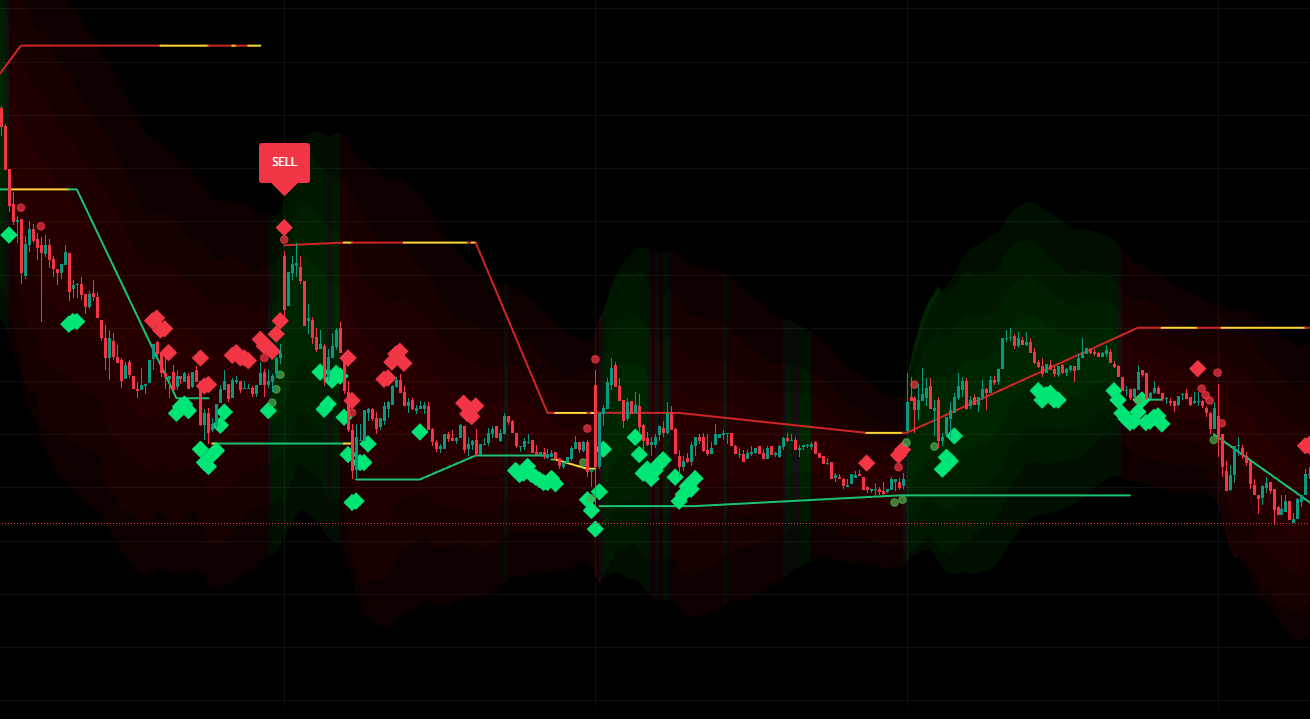
Dynamic resistance line
Dynamic support line
Broken support/resistance line (model learned from it)
Sell Signal
Max predicted volatility area (3D wave)
Large sell block
Large buy block
Divergence downtrend, slowing trend
Divergence uptrend, trend is speeding up
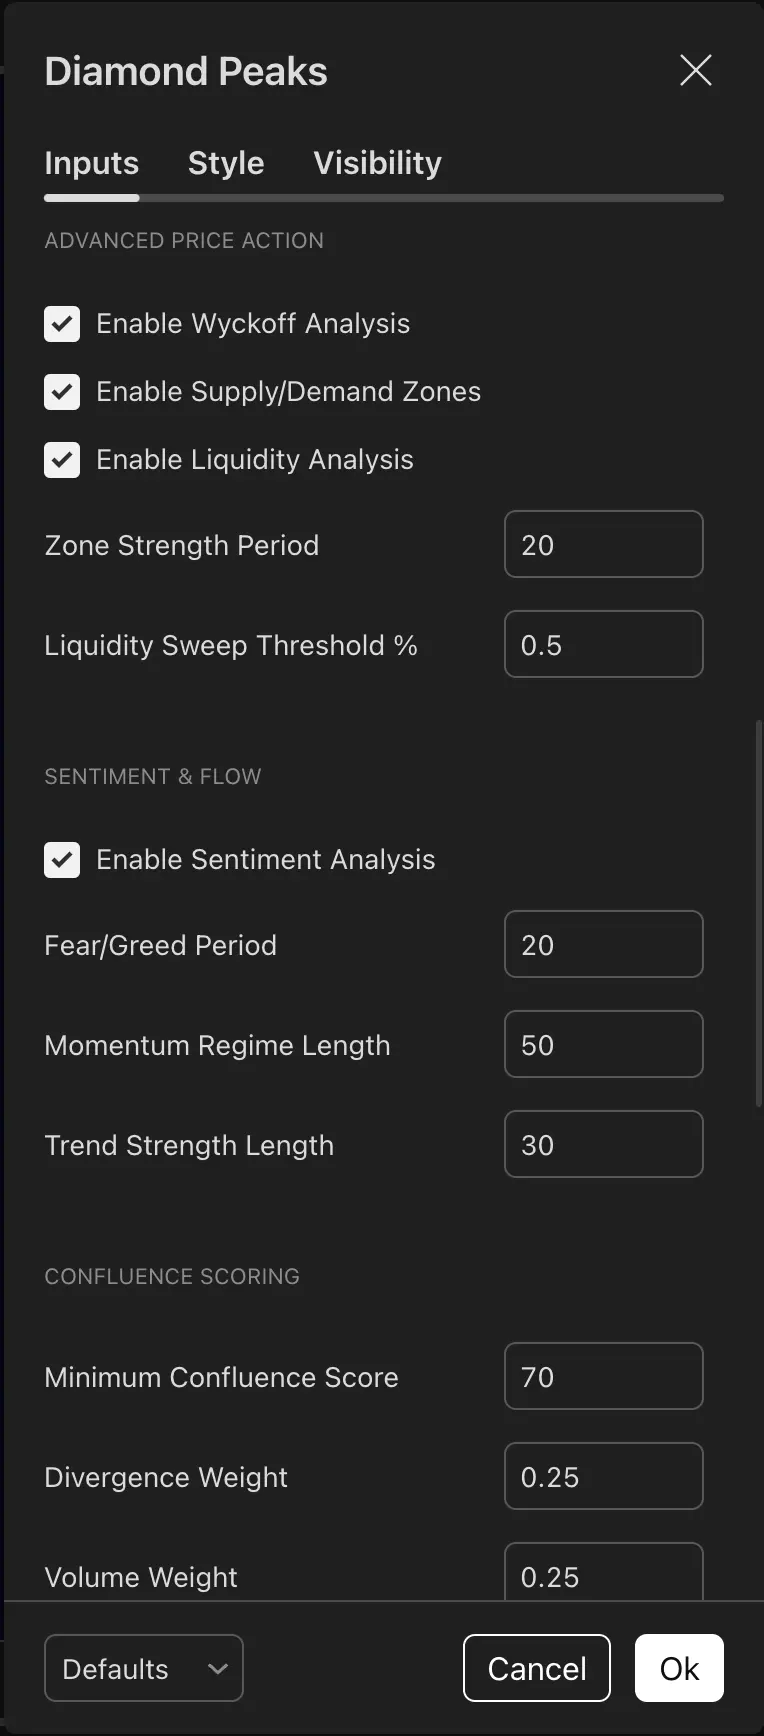
Wyckoff accumulation/distribution detection
Identifies fresh supply and demand zones
Detects liquidity sweeps and stop hunts to avoiding false signals
Percentage move required to confirm liquidity sweep
fear/greed index and regime classification for market context assessment