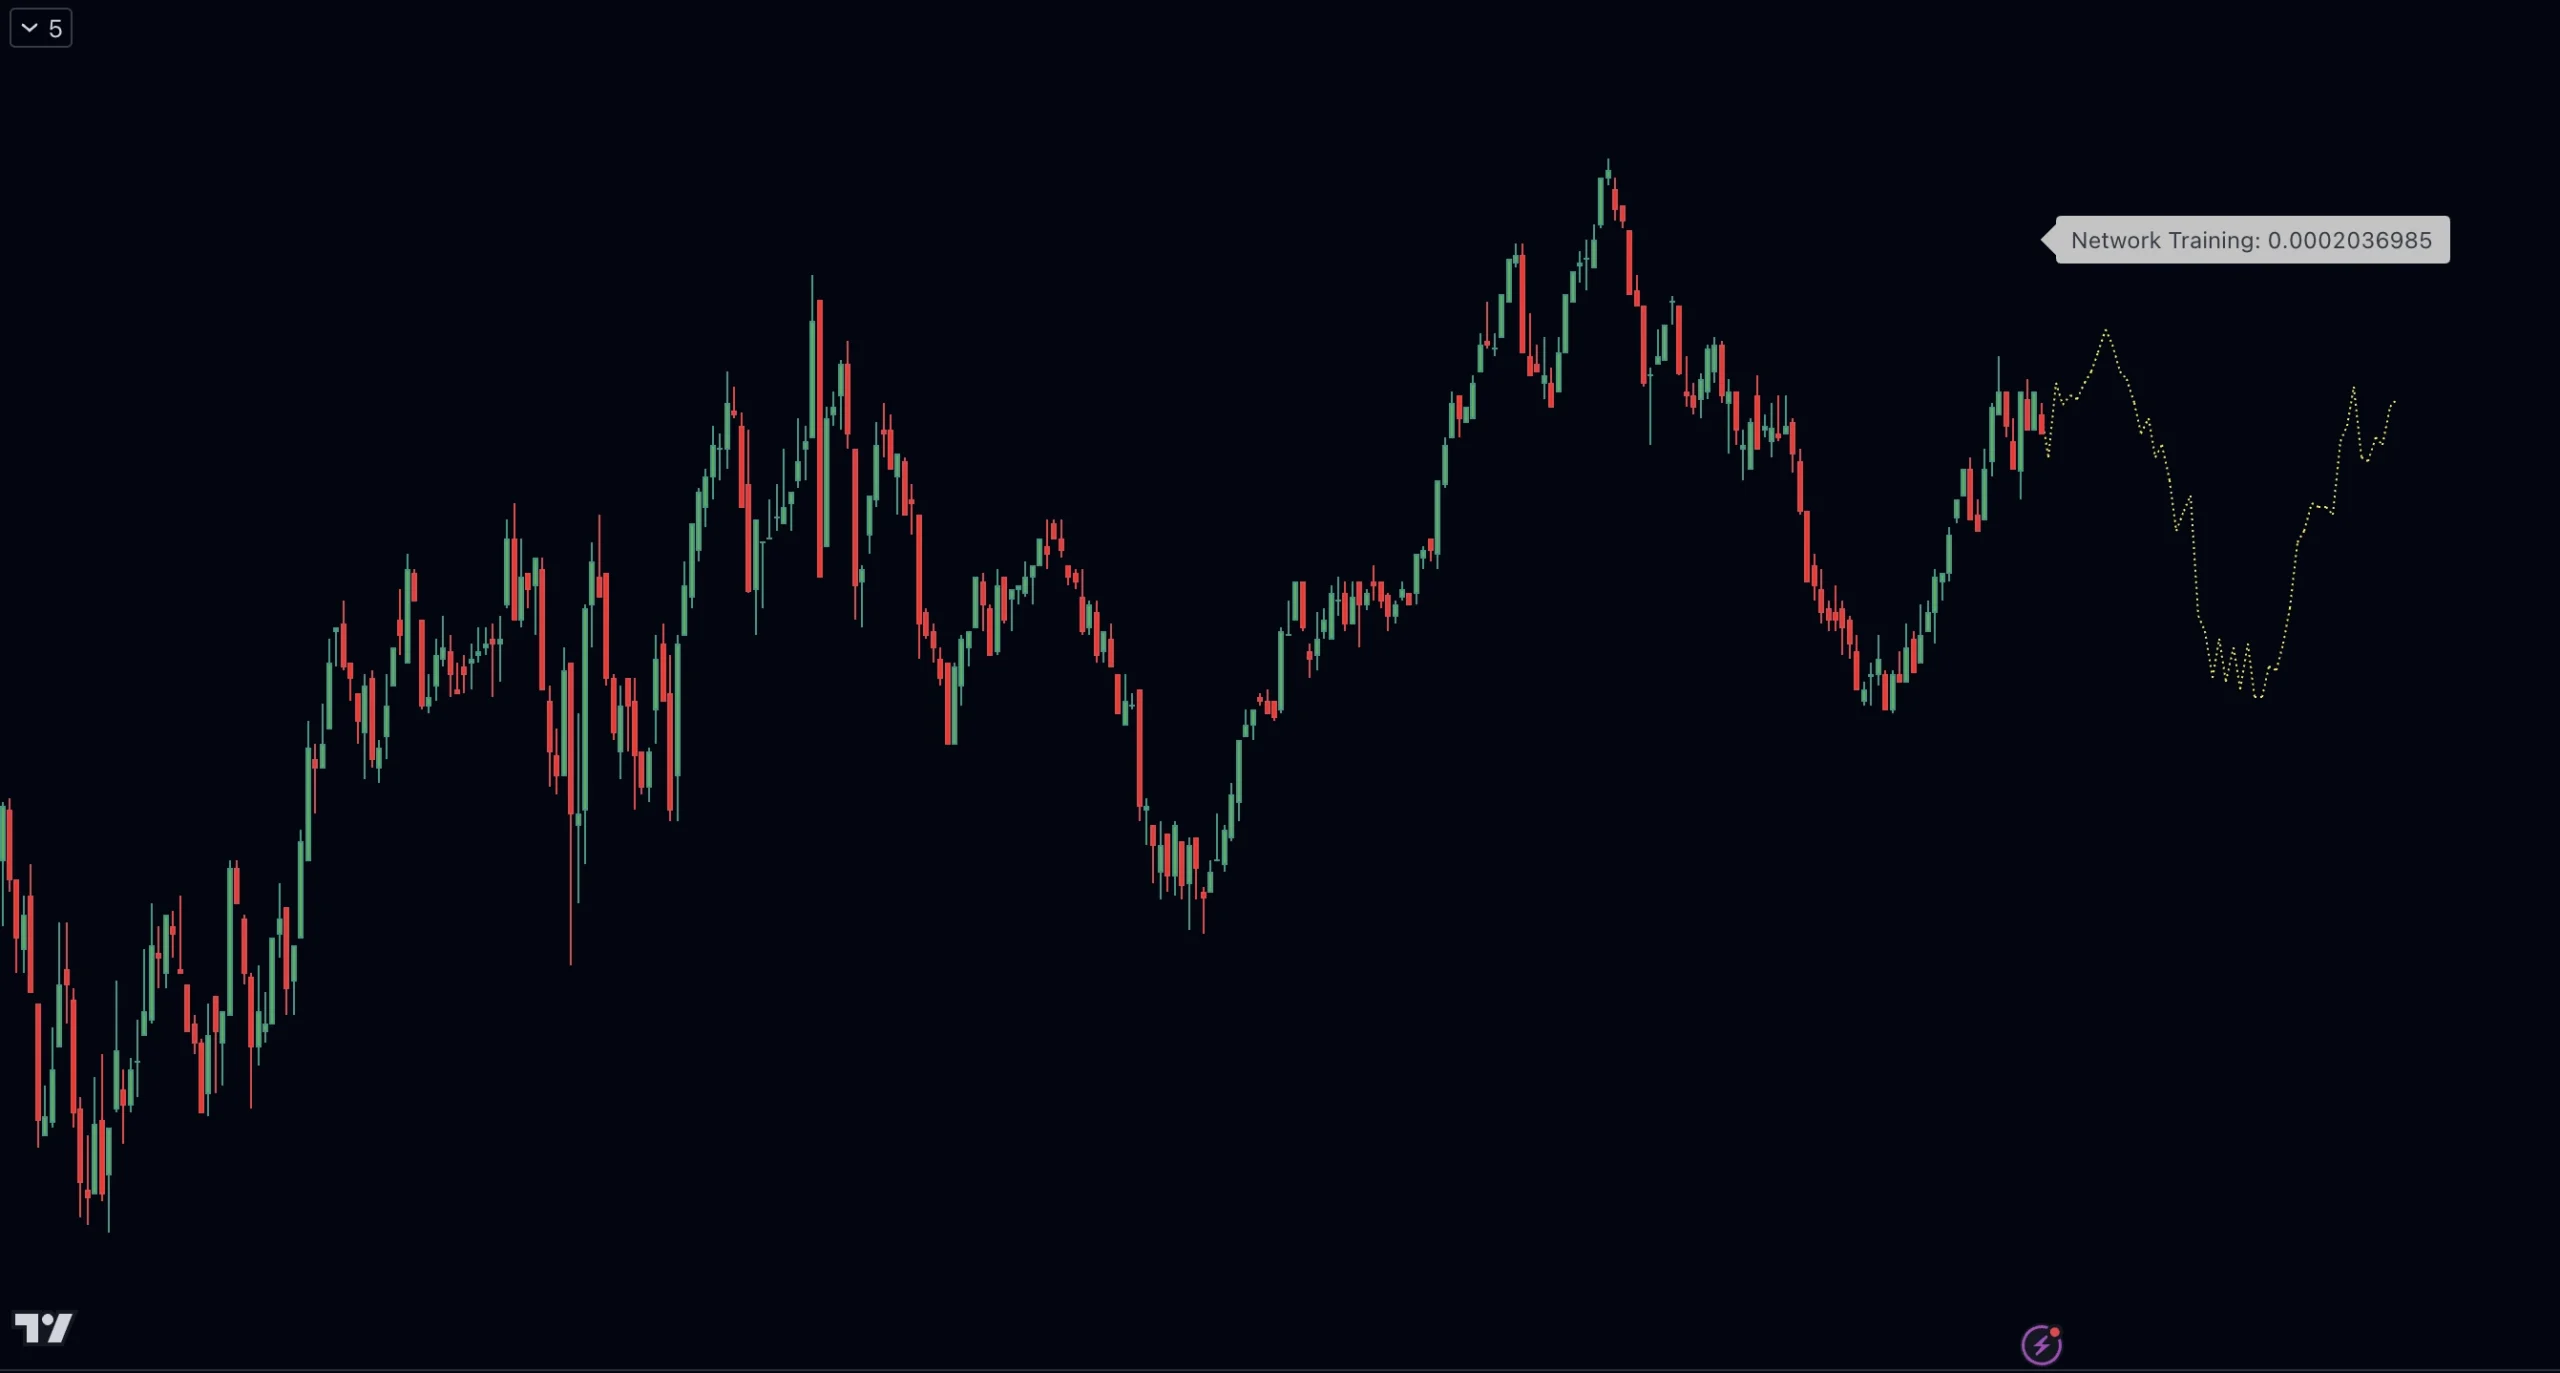
Use The Most Advanced TradingView AI to Forecast The Market Direction

Edge AI inputs 82 different data points on a live chart into an advanced neural network to give you a highly accurate forecast of market direction

The Technology Behind It.

First Ever 256 Point AI Indicator

Edge AI is the first ever indicator that uses a 256 point neural network on Pine Script, a remarkably difficult type of indicator to build with the limits of Pine Script, yet our team was able to achieve it. Learn how this works in detail in this video.

Let The Neural Network Do The Thinking

Direction Forecast

Network Training Rate

Edge AI chart is made of a simple element, designed to integrate cleanly with other indicators while displaying effective and important information.

The indicator shows a price forecast line where you can see the predicted direction, and also a network training tag which can be turned off.

The training rate is used when optimizing the indicator for maximum accuracy. The idea is to get this number to be as low as possible. When this is achieved, you can remove the tag from the indicator settings and just see the forecast line.

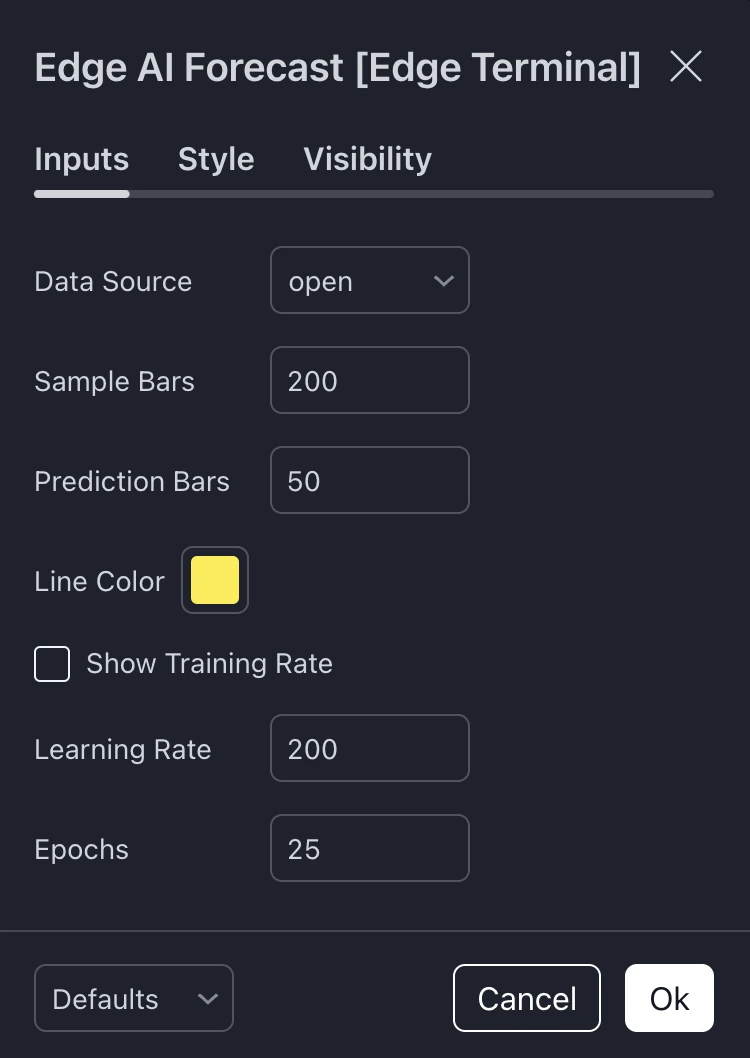
Sample data to input into network

How many bars to be forecasted

How training rate tag on the chart

How many times to change the model in response to error

Cycles or number of times to run the data through the entire network

Sample Bars

The number of bars or data points to look back and put into the network to start the prediction process. The higher the number, the more accurate results become, but indicator becomes slower.

Prediction Bars

The number of bars you want the script to forecast on the chart. We recommend 50 but you can change it per your use case. The larger the number becomes, the less effective or risky predictions become.

Show Training Rate

Shows the training rate tag on the chart in order to help you optimize. The idea is for you to see the values and change the inputs to bring the error rate as low as possible.

Learning Rate

How many times you want the script to change the model and try again to improve based on the estimated error (training rate).

Epochs

The network cycles. How many times you'd like the data to be passed from the first to the last layer. This is the overall epoch and increasing it can slow down the indicator. Adjust per your use case.

Ready to upgrade your charts?

Take a monumental step forward in your trading journey