
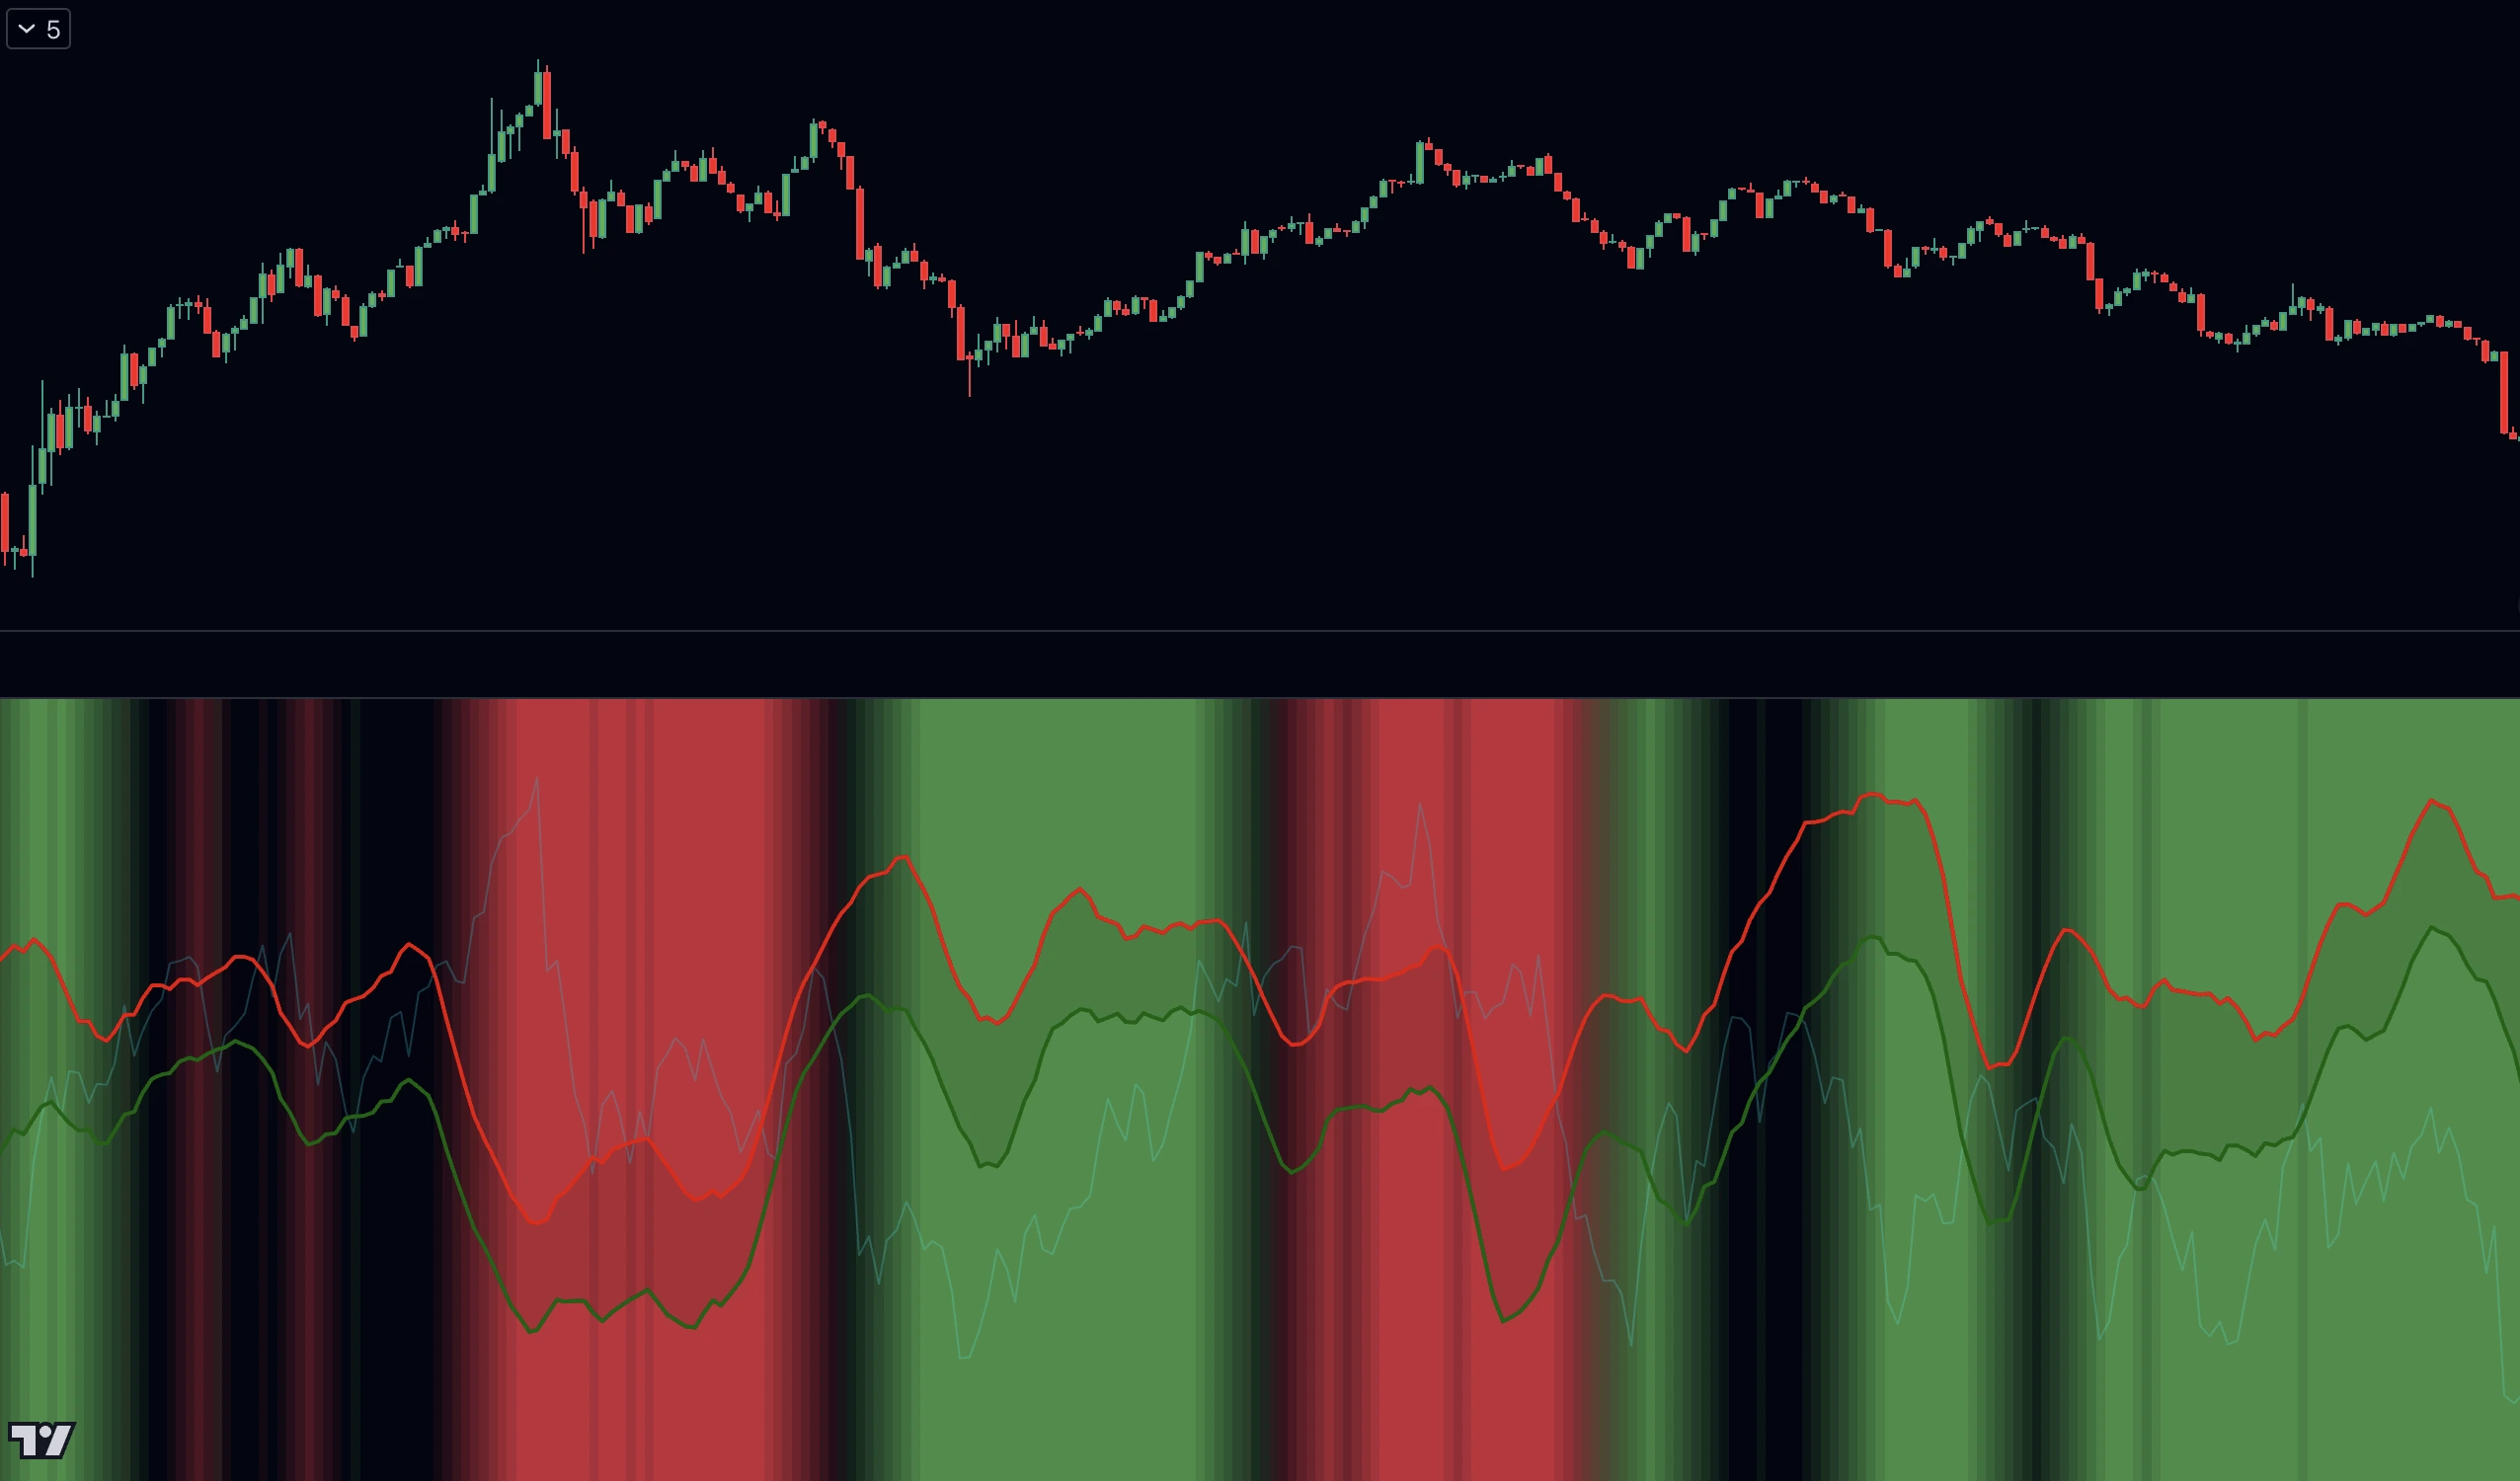
Overbought trend
Oversold trend
Monte Carlo RSI upper and lower bands
Common RSI over Monte Carlo RSI band crossover
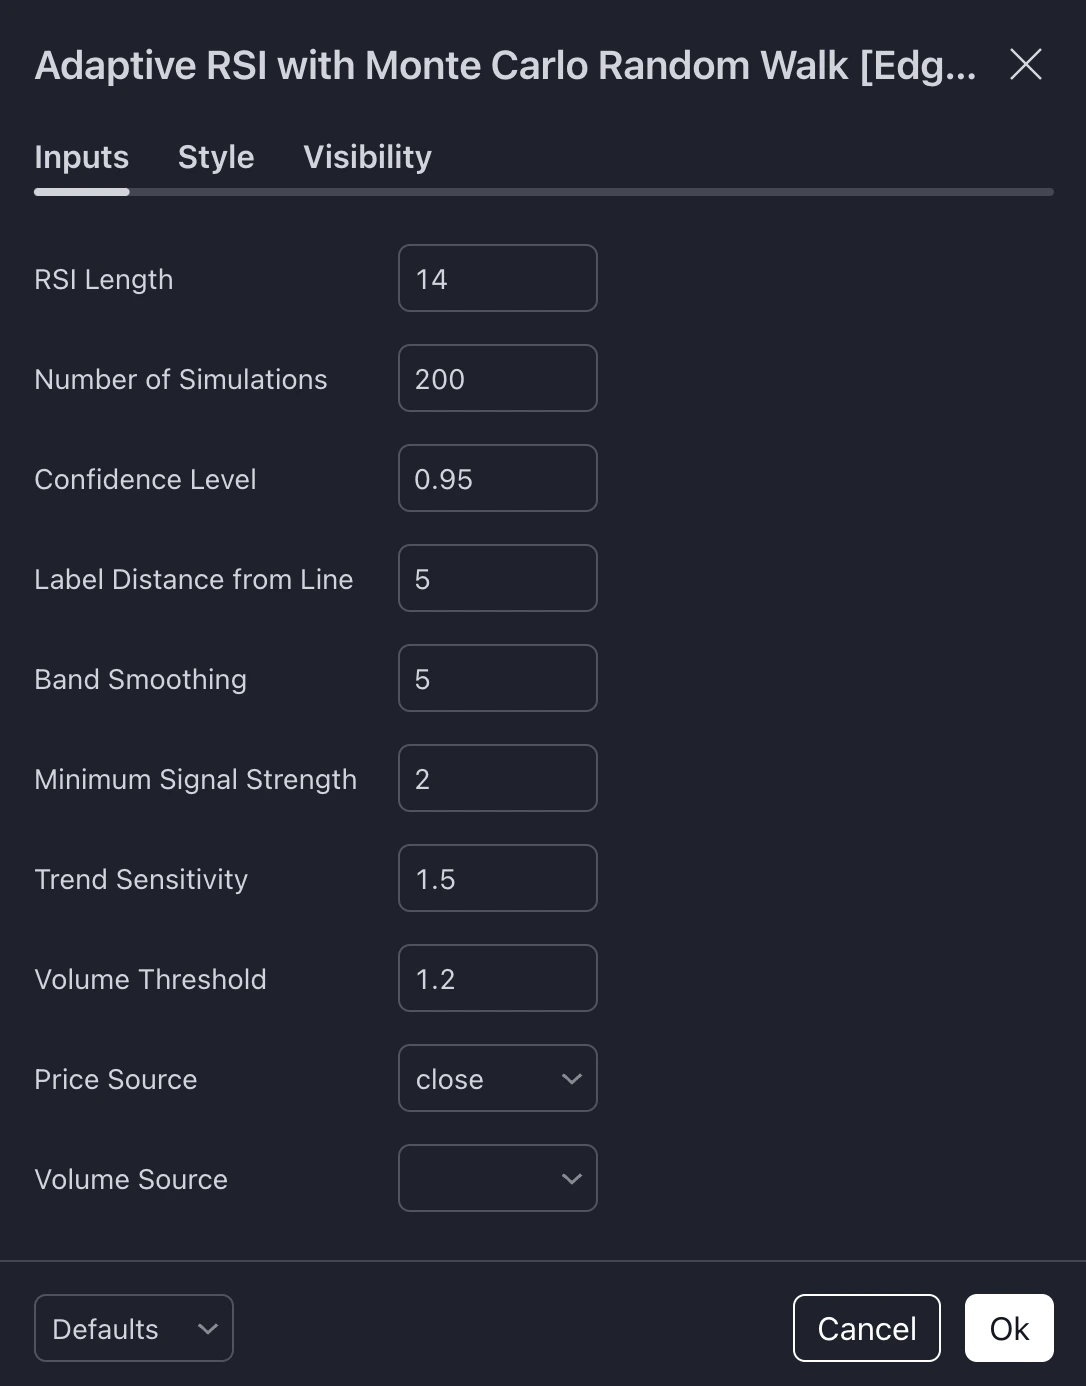
Controls Monte Carlo simulation count
Statistical significance of bands
Normalizes RSI deviation by ATR
Strength relative to volatility
Compares current volume to average